Prometheus & Grafana Monitoring Stack
CompletedSelf-hosted Prometheus + Grafana observability across the Proxmox cluster, TrueNAS storage and core services.
Tech stack:
Docker
Grafana
Linux
node_exporter
Prometheus
Proxmox
A self-hosted monitoring and observability stack for the homelab, built on Prometheus for metrics collection and Grafana for visualisation and alerting. It gives a single pane of glass across the Proxmox cluster, TrueNAS storage, and the containerised services running behind Nginx Proxy Manager.
What it does
- Scrapes metrics from every node and service via node_exporter, cAdvisor and app-level exporters.
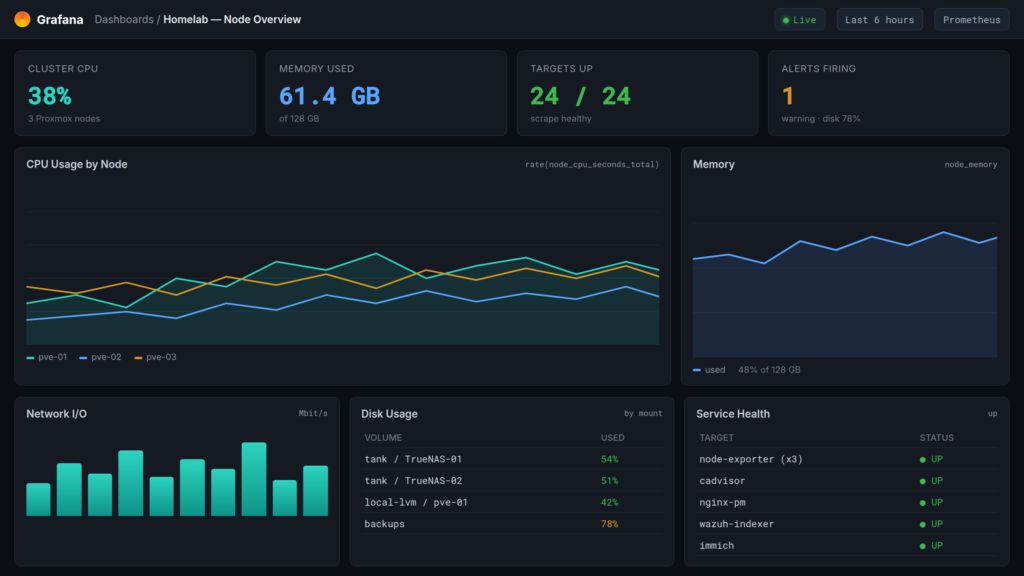
- Central Grafana dashboards for CPU, memory, network I/O, disk usage and service health.
- Alerting on thresholds (e.g. disk usage, node down, scrape failures) so problems surface before they bite.
- Long-term metric retention for capacity planning across the cluster.
How it fits the homelab
- Monitors the 3-node Proxmox HA cluster and both TrueNAS boxes.
- Tracks health of core services: Nginx Proxy Manager, Authentik, Vaultwarden, Immich and the Wazuh stack.
- Runs as containers, proxied and secured behind SSO.
The dashboard shown is a representative Node Overview — swap in a screenshot of your live Grafana instance any time.